

BBT Charting: Your Hormones Have a Pattern. This Is How You Read It
Tracking your temperature each morning reveals when you ovulate, how strong your hormones are, and whether your body is ready for implantation. BBT charting can transform your fertility journey.

Temping
Also known as BBT charting, is one of the most effective tools for understanding your fertility. It allows you to track hormonal shifts in real time and gives insight into ovulation, progesterone levels, luteal phase length, and early implantation signs.
Unlike apps that predict your fertile window or LH strips that forecast a surge, BBT confirms what has already happened. It tells you whether ovulation occurred and whether your body is hormonally prepared to support a pregnancy.
This simple daily habit can improve conception rates, identify hormone imbalances, and help you time intercourse or treatment with greater confidence. It requires no prescriptions, no clinic, and no guesswork — only consistency and awareness.
What Is BBT?
BBT stands for basal body temperature. It is the body’s lowest resting temperature during deep sleep and is measured first thing in the morning before speaking, moving, or getting out of bed.
This temperature responds to hormonal changes, especially progesterone, which rises after ovulation and slightly warms the body. A sustained rise of 0.2 to 0.5 degrees Celsius for three consecutive days confirms ovulation. This thermal shift shows that the body has moved from the estrogen-dominant follicular phase into the progesterone-driven luteal phase.
As explained by Nora Pope, a certified fertility educator, “If there is no sustained rise, there was no ovulation.” A successful chart confirms what OPKs cannot — that ovulation actually occurred and was hormonally supported.
BBT charting is not about prediction. It is about confirmation.
What Else Should You Track?
A complete chart includes more than temperature. Each sign contributes a different piece of information about your cycle:
BBT (°C) – Confirms ovulation and tracks luteal stability
Period / Spotting – Indicates true cycle day one
Cervical Mucus – Changes in texture and stretchiness reflect rising estrogen and peak fertility
Cervix Position and Firmness – High, soft, and open indicates ovulation is approaching
LH Test Results – Predict when ovulation may happen
HCG Test Results – Confirm pregnancy after implantation
Sex / Intercourse – Helps align timing with fertile days
Symptoms / Sleep / Illness / Alcohol – Track disruptions that may skew temps
What a Healthy BBT Chart Looks Like
According to The Fertility Homeopath, a healthy BBT chart includes:
Low follicular temperatures – Typically between 36.2 and 36.5 °C
Ovulation dip – A brief drop in temperature before ovulation (optional)
Thermal shift – A rise of at least 0.2 °C sustained over three days
Luteal phase plateau – Stable high temps for 12 to 14 days
Drop or implantation rise – Temps drop before a period or rise further with implantation
What BBT Can Tell You
✅ Ovulation confirmation
✅ Luteal phase length
✅ Progesterone quality
✅ Implantation signs
✅ Thyroid function
✅ Stress and inflammation
Fertility and Contraception: Dual Purpose Charting
BBT charting is not only for conception. When used alongside cervical mucus and cervix tracking, it is an effective Fertility Awareness Method.
To conceive, time intercourse in the days leading up to and just after ovulation.
To avoid pregnancy, abstain or use protection during the fertile window and confirm ovulation with BBT before resuming unprotected sex.
With proper instruction, fertility awareness methods are up to 98 percent effective.
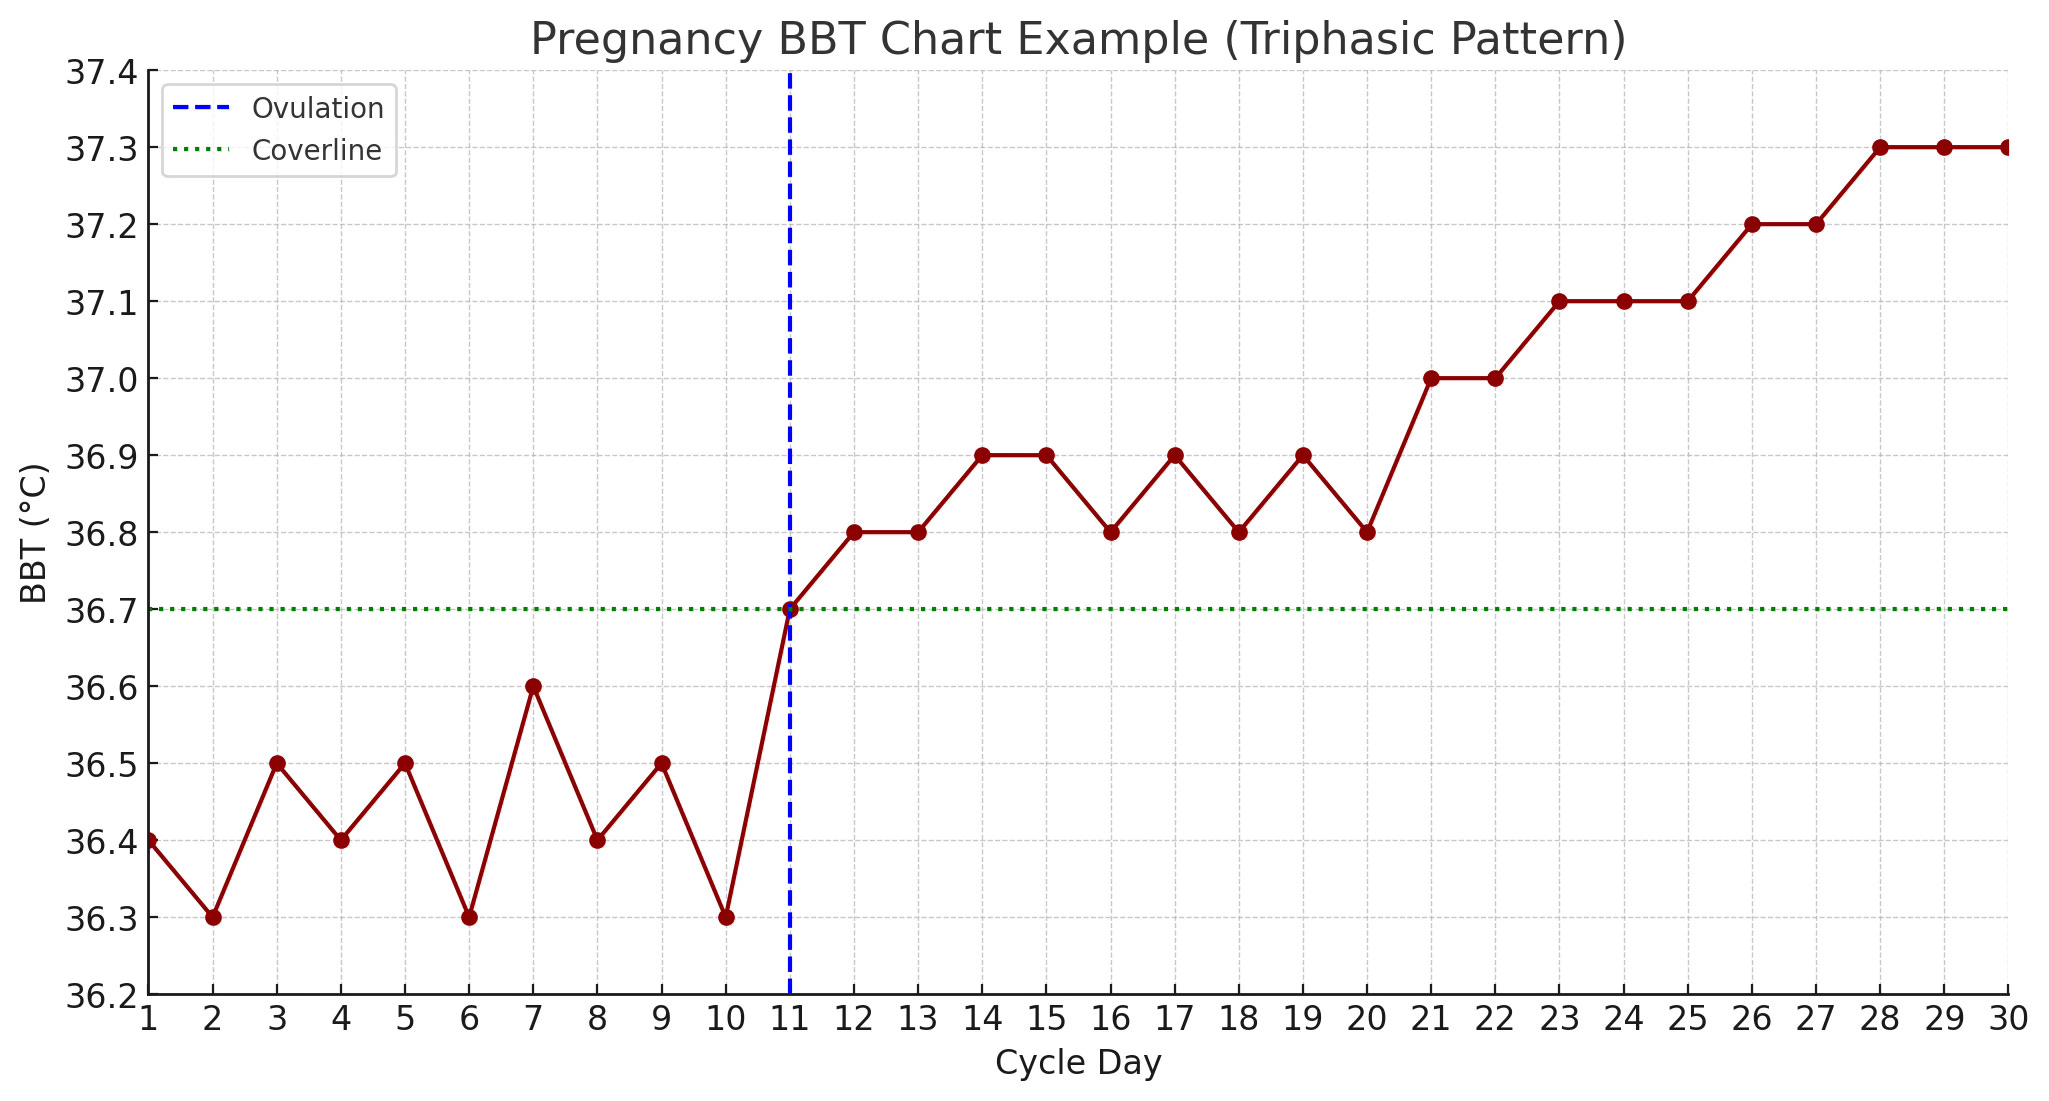
What a Pregnancy Chart Looks Like
After ovulation, your BBT should stay elevated for 12 to 14 days. If it remains elevated beyond 16 days, this is often the first sign of pregnancy.
In early pregnancy, many women experience a triphasic pattern — a second rise in temperature after implantation. This often occurs around 6 to 10 days after ovulation, and temps may reach above 37.0°C, staying consistently high.
Below is an example of a pregnancy BBT chart showing ovulation, luteal rise, and a triphasic pattern after implantation:
How to Chart Accurately
Use a basal thermometer with two decimal points
Take your temperature at the same time every morning
Avoid taking readings after poor sleep, illness, or alcohol
Log additional symptoms and signs
Look for patterns across your full cycle — not isolated readings
Track on Paper or Digitally
Top BBT Apps:
Kindara
Fertility Friend
Read Your Body
OvuView
Prefer paper? 👉 Download this printable BBT chart By Baby Center
Final Thoughts
BBT charting teaches you how to listen. It turns uncertainty into clarity and transforms your relationship with your body’s cycle.
If you are trying to conceive, BBT confirms your timing. If you are preventing pregnancy, it confirms your safety. If you are watching your hormones, it confirms your balance.
And if you are pregnant — it might be the first sign you ever see.
Fertility Essentials
Ovulation Predictor Kits
Femometer LH Tests: https://amzn.to/43QhKE8
Clearblue Digital: https://amzn.to/3HuyEQV
Pregnancy Tests
First Response Early Result: https://amzn.to/3HuZp7V
Clearblue Weeks Indicator: https://amzn.to/3FFvfOU
Line Progression Favourite: https://amzn.to/4ksnlau
Video References
The Fertility Homeopath – What My BBT Chart Is Telling Me
Nora Pope FCP – How to Chart Your Basal Body Temperature
This was such clear explanation of the value of this method of tracking. The BBT is so often glazed over in the cycle syncing discussion. Thank you for breaking it down! 🙏🏽